
Blog
Why does an 830 nm phototherapy lamp shift to 838 nm after being turned on for half an hour?
A field measurement of an 8-channel, 9-wavelength phototherapy light source: discussing LED wavelength “thermal drift”
“You claim it is 830 nm; why does my measurement show 838 nm?”
This is one of the technical questions we have been asked most frequently this year. Those who ask it often do so with a hint of skepticism, implying: “Are you just inflating the figures?”
The answer is usually simpler than one might imagine: the LED chip is not lying; it is simply generating heat. As long as an LED is turned on, its junction temperature rises; once the junction temperature rises, the light’s wavelength shifts toward the longer-wavelength end. This is a consequence of semiconductor physics, not a process defect or a supplier cutting corners.
However, there is a boundary between “normal” and “exceeding the limit.” Using measured data from an 8-channel, 9-wavelength phototherapy device, this article clearly delineates that boundary.
I. Why Wavelengths “Shift”: The Bandgap Width Is Shrinking
The wavelength of LED light emission is determined by the bandgap width of the chip material; the two are inversely related: the narrower the bandgap, the lower the photon energy and the longer the wavelength.
When the temperature rises, the semiconductor lattice expands and the interatomic spacing increases, causing the bandgap to narrow accordingly; consequently, the wavelength shifts toward longer wavelengths—a phenomenon known in the industry as “redshift.” An infographic explains this process:
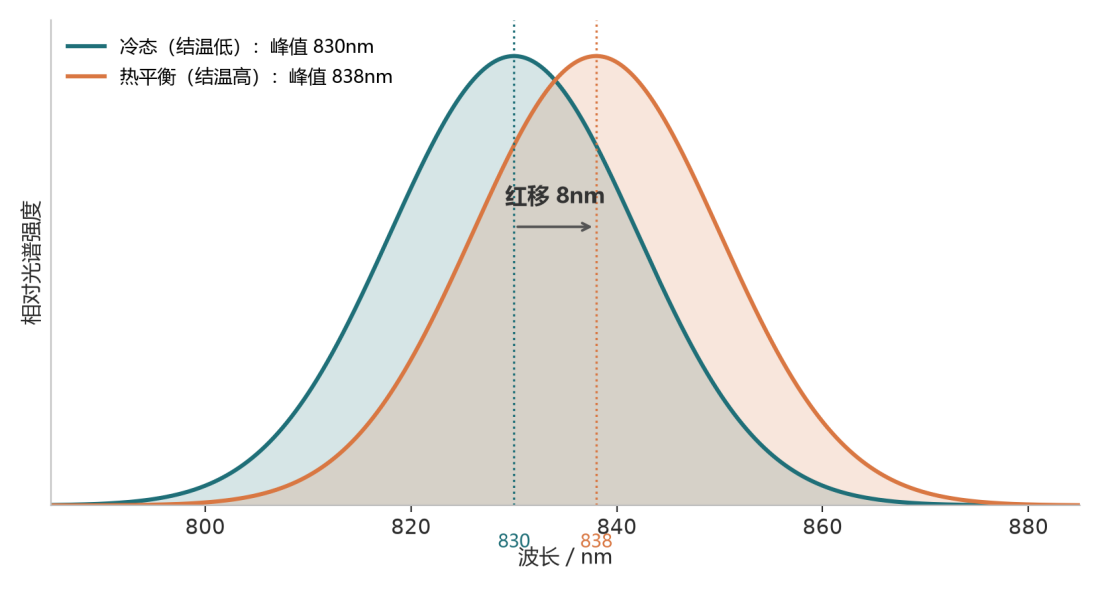
Figure 1: Spectral comparison of the same 830 nm LED in its cold-state and thermally equilibrium states (schematic)
The issue is that the temperature sensitivity of different materials differs by nearly a factor of ten:
| wavelength | Typical semiconductor materials | Warm-up drift coefficient(nm/℃) |
| 450nm | InGaN | 0.03 ~ 0.05 |
| 535nm | InGaN | ~0.03 |
| 630 ~ 660nm | AlGaInP | 0.06 ~ 0.15 |
| 810 ~ 850nm | GaAs / AlGaAs | 0.2 ~ 0.3 |
| 940nm | GaAs | ~0.25 |
The pattern is clear: the longer the wavelength, the faster the drift. The drift rate in the near-infrared channel is approximately twice that of visible red light. Plotting the two curves together provides a more intuitive representation:
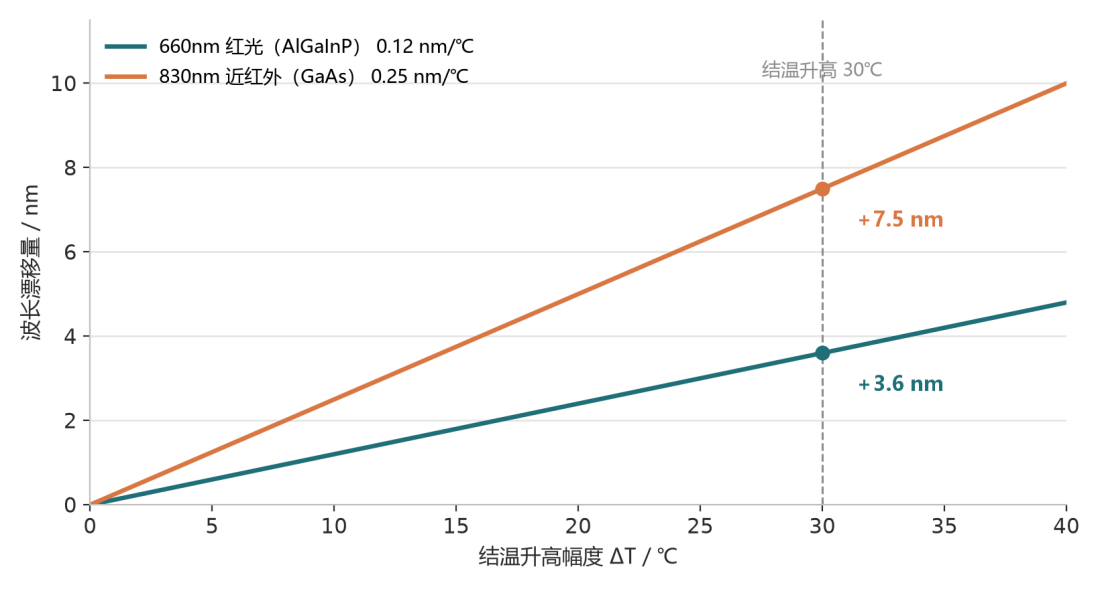
Figure 2: For every 1℃ increase in junction temperature, the wavelength shifts to the right by a distance approximately twice as large for red light compared with near-infrared light.
Taking 830 nm as an example, if the junction temperature rises by 30 °C, the wavelength may shift by 6–9 nm. This figure may sound small, but it already exceeds the ±5 nm tolerance typically specified in most datasheets—hence the skepticism expressed at the outset.
II. “What Constitutes Normal”: Considering the Three Lines Together
Determining whether wavelength drift is acceptable cannot be based on a single figure alone. Internally, we use the intersection of three lines for assessment.
Article 1: Material-related drift. Within the 810–850 nm wavelength range, a drift of 0.2–0.3 nm per 1 °C increase in temperature is attributable to the physical behavior of the material itself; if the drift clearly exceeds this range, it indicates the presence of excessive current drive or inadequate local heat dissipation. In that case, the phenomenon is not “normal drift,” but rather a design issue.
Article 2: Treatment Window. The effective photobiomodulation window for red light is approximately 630–680 nm, while that for near-infrared light is 800–880 nm. Cytochrome c oxidase has an absorption bandwidth of several tens of nanometers; a shift of 3–6 nm will not cause the biological response to “turn off.” Therefore, as long as the wavelength after thermal equilibrium remains within the window, the impact on actual therapeutic efficacy can be neglected.
Article 3: Consistency Line. After thermal equilibrium is reached, the spectrum should stabilize. If the readings at 30 minutes and 60 minutes continue to change unidirectionally without converging, this indicates that the entire unit has not yet reached thermal equilibrium, or that its heat dissipation capacity is insufficient.
The three parameters can be converted into engineering thresholds as follows: for the red-light channel, a drift of ≤4 nm and for the near-infrared channel, ≤8 nm are considered normal; 8–12 nm warrants attention; and once it exceeds 12 nm, the heat dissipation design should be revised.
III. Field Measurement: 60 minutes on an 8-channel, 9-wavelength device
The test subject is our own GY-RLT64 multi-channel phototherapy light source: featuring eight-channel drive and coverage of nine wavelengths—590 / 630 / 660 / 670 / 810 / 830 / 850 / 940 / 1060 nm. With the entire unit powered continuously, spectra and electrical power were recorded at three time points: 1 min, 30 min, and 60 min after cold start.
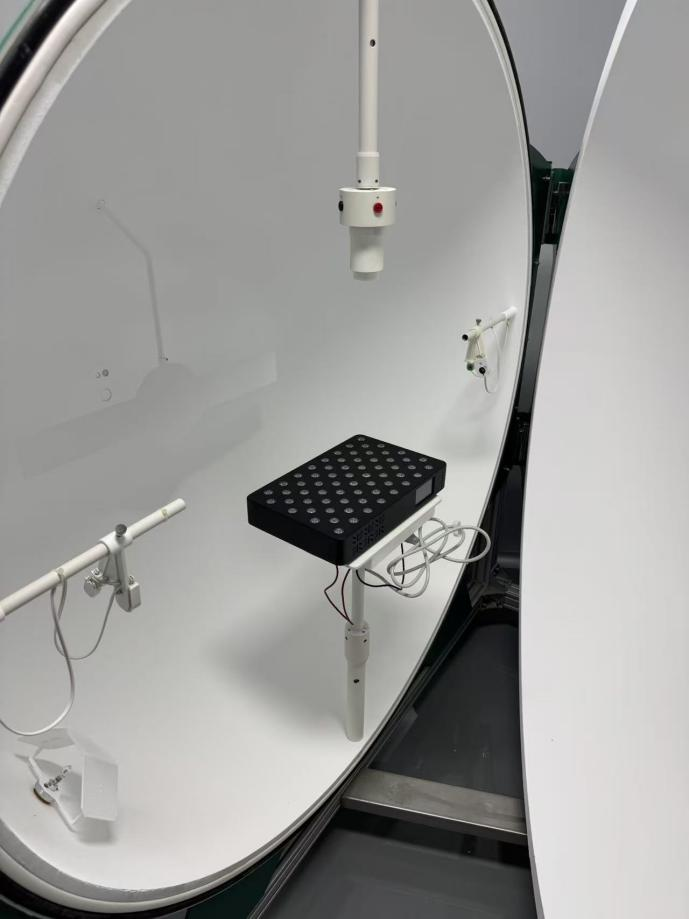
Figure 3: Test diagram of the company’s GY-RLT64 integral sphere (not activated)
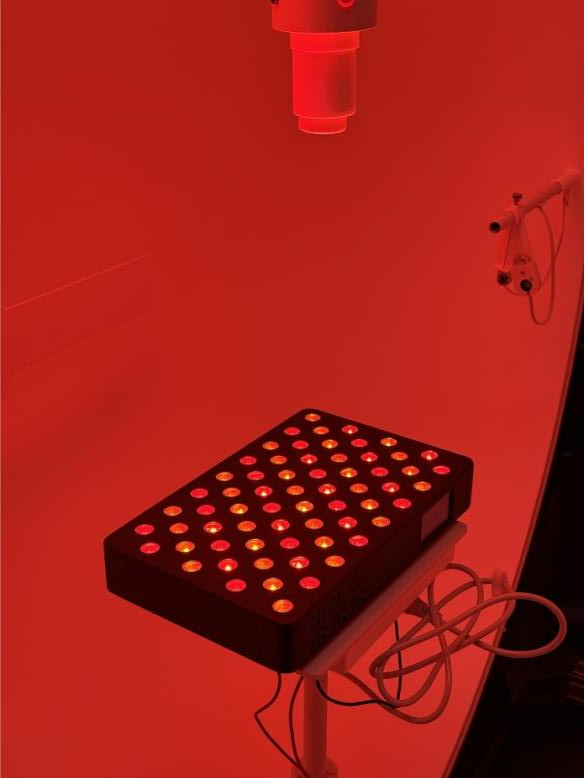
Figure 4: Test diagram of the company’s GY-RLT64 integral sphere (startup)
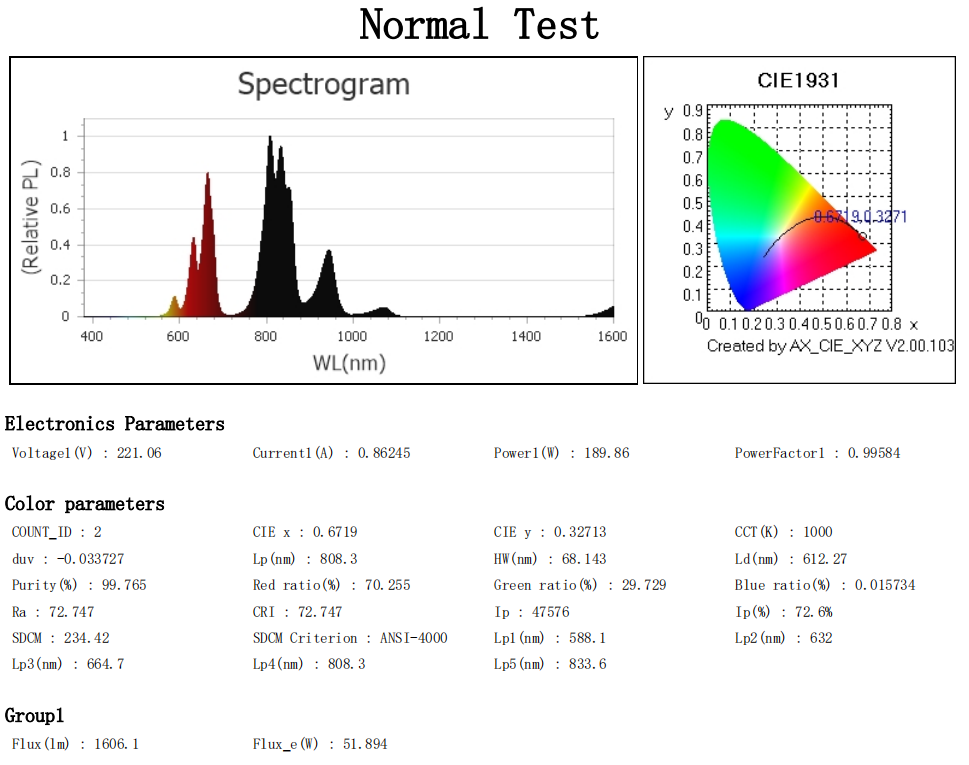
Figure 5: Test report for GY-RLT64 after 1 min of operation (all channels enabled)
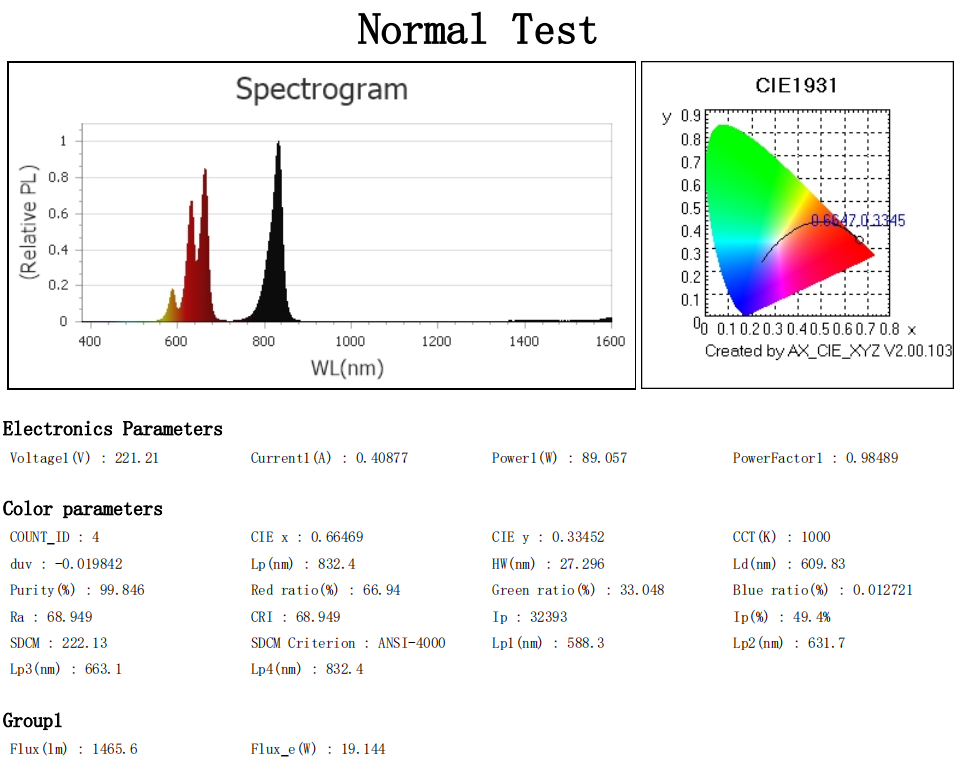
Figure 6: Test report for GY-RLT64 after 1 min of operation (channels 590,630,660, and 830 nm enabled)
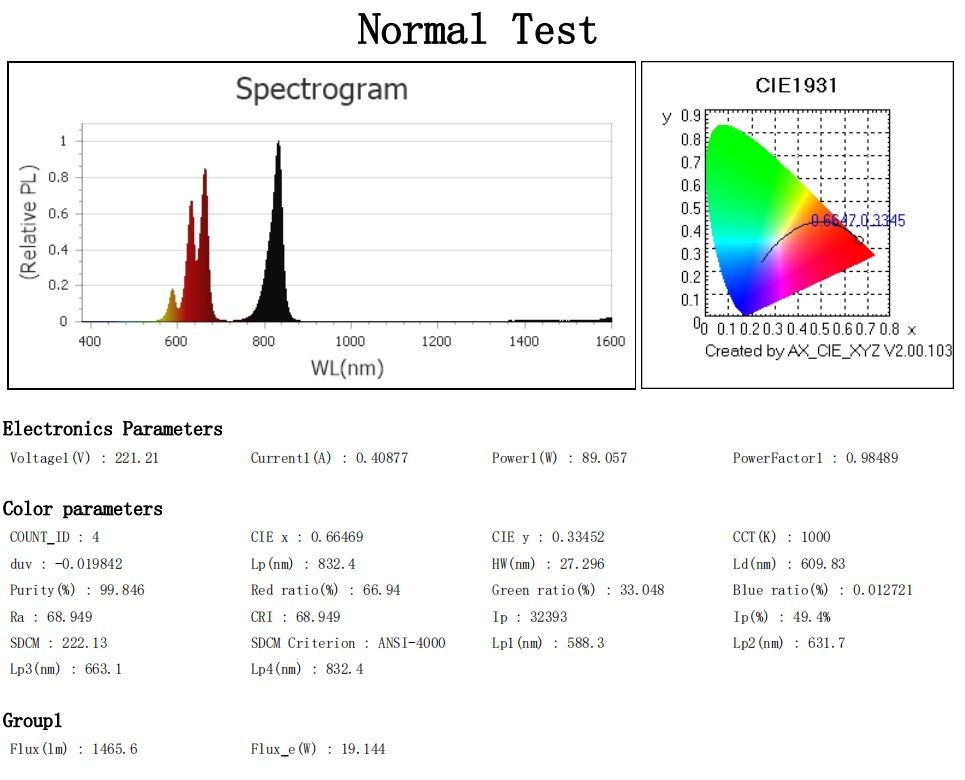
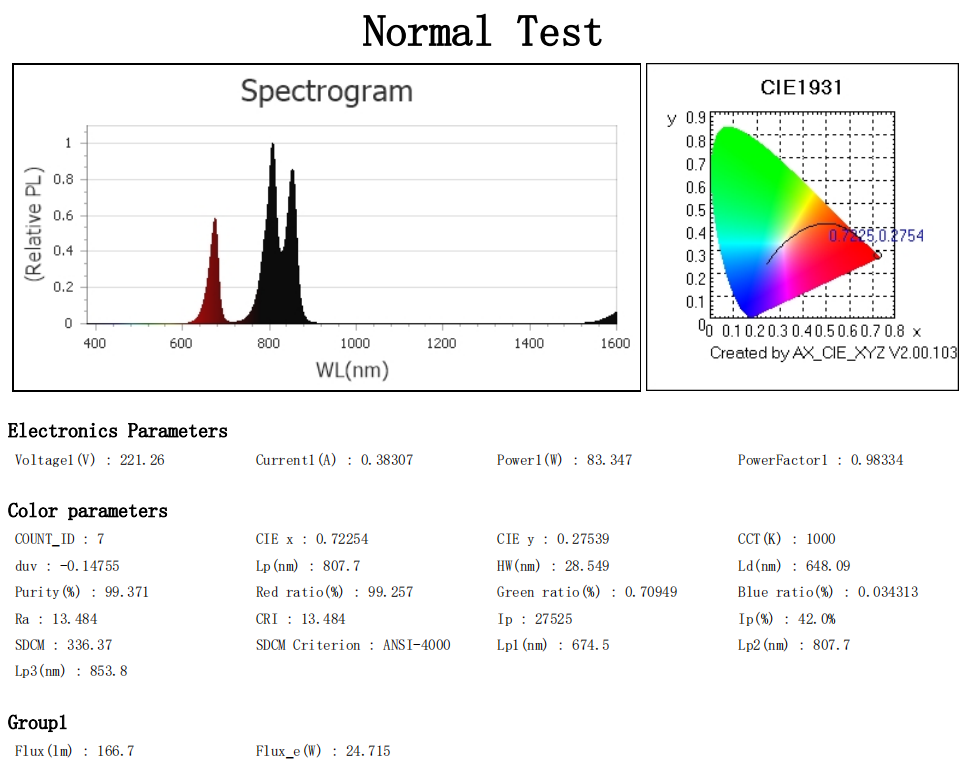
Figure 7: Test report for GY-RLT64 after 1 min of operation (channels at 670 nm, 810 nm, and 850 nm enabled)
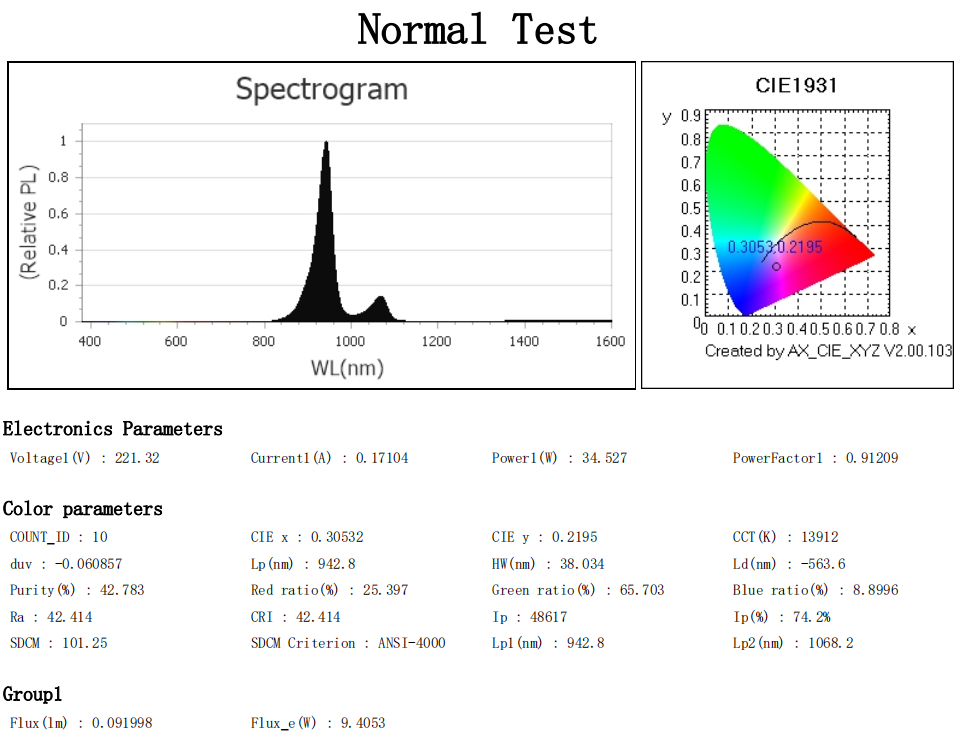
Figure 8: Test report for GY-RLT64 after 1 min of operation (940 nm and 1060 nm channels enabled)
Table 1: Power output of the GY-RLT64 at 1, 30, and 60 min of operation
| Runtime | mean power | Relative cold state |
| 1min(cold position) | 189.9 W | — |
| 30min | 181.2 W | -4.6% |
| 60min | 181.1 W | -4.6% |
First, consider the electrical power:
Power dropped by 4.6%, and between 30 and 60 minutes, the difference was only 0.1 W. Both of these details are highly informative: the fact that power decreases rather than increases indicates that the driver is a constant-current source (constant-voltage driving would cause the current to increase as Vf decreases, causing power to rise instead, thereby creating a positive thermal runaway feedback loop); the fact that power remains virtually unchanged after 30 minutes indicates that thermal equilibrium has been reached.
Table 2: Measured wavelengths of GY-RLT64 at 1, 30, and 60 min of operation
| Wavelength(nm) | 1min | 30min | 60min | 30min drift | 60min drift |
| 590 | 588.3 | 591.8 | 590.7 | +3.5 | +2.4 |
| 630 | 631.7 | 635.0 | 634.1 | +3.3 | +2.4 |
| 660 | 662.9 | 666.6 | 665.7 | +3.7 | +2.8 |
| 670 | 674.6 | 676.9 | 676.5 | +2.3 | +1.9 |
| 810 | 807.7 | 812.6 | 811.2 | +4.9 | +3.5 |
| 830 | 832.4 | 838.2 | 836.5 | +5.8 | +4.1 |
| 850 | 853.4 | 857.3 | 856.6 | +3.9 | +3.2 |
| 940 | 942.5 | 946.8 | 946.1 | +4.3 | +3.6 |
| 1060 | 1068.1 | 1074.4 | 1073.3 | +6.3 | +5.2 |
Now consider the wavelength:
The 1060 nm channel, which exhibits the greatest drift, showed a drift of 6.3 nm; the 830 nm channel showed 5.8 nm; and the red-light channels generally exhibited drifts between 2 and 4 nm. Dividing the drift value by the temperature rise yields a conversion factor ranging from 0.07 to 0.19 nm/℃, which is consistent with the material table above—this indicates that no individual LED chip is operating under overcurrent conditions and that the heat distribution across the LED board is uniform.
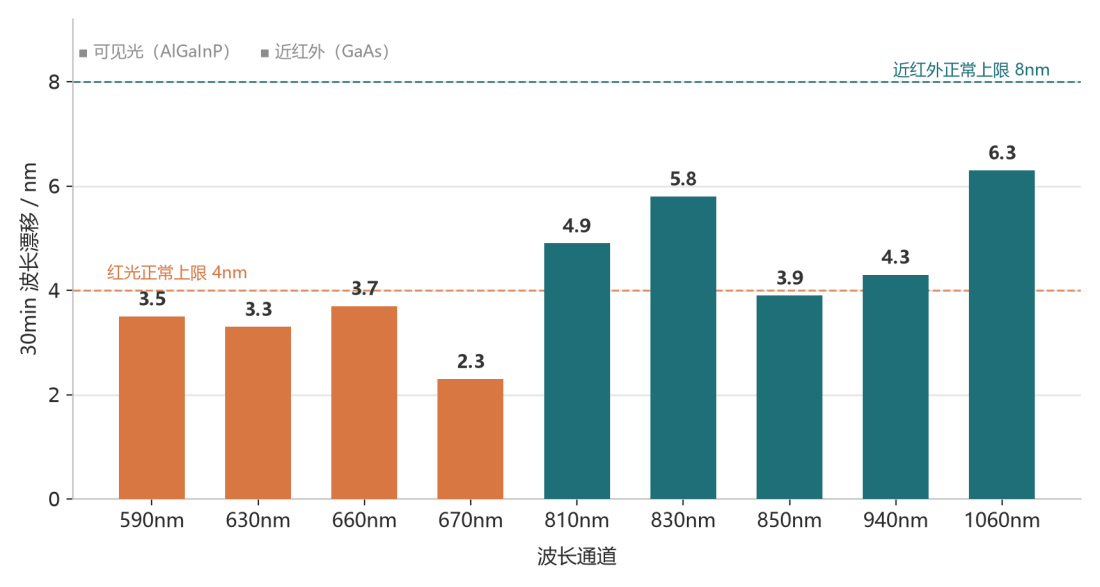
Figure 9: 30-min drift across 9 wavelength channels: all fall within the “normal” range
There is also another form of cross-validation that deserves to be discussed separately:
- Based on power calculations: the temperature coefficient of Vf is approximately-1.5 to-2 mV/℃; a 4.6% decrease corresponds to a junction temperature rise of 35–37 °C;
- Based on wavelength: at 830 nm, the drift is approximately 8 nm; dividing this by the coefficient of 0.25 nm/℃ yields a corresponding junction temperature rise of approximately 33 °C.
Two completely independent measurement paths that point to the same temperature. This self-consistency provides stronger evidence of the credibility of the test data than any single indicator alone.
By plotting power against the wavelength of the 830 nm channel on the same graph, the overall behavior of the system becomes immediately apparent:
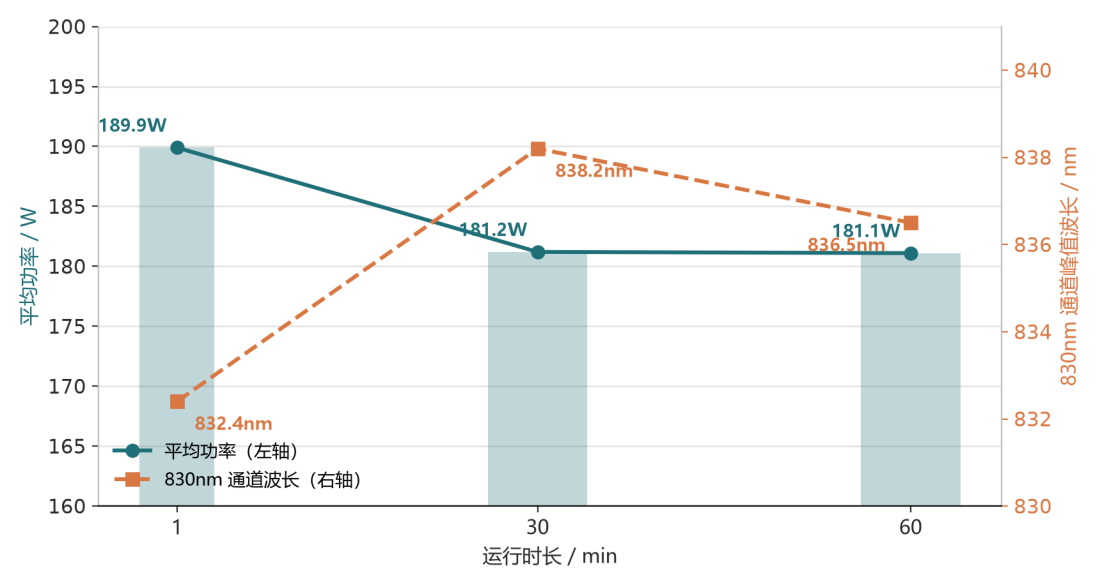
Figure 10: Power converges within 30 min (left axis); the 830 nm channel wavelength stabilizes synchronously (right axis)
IV. A counterintuitive detail: at 60 minutes, the wavelength “retrogressed”
A closer examination of the table and figures above reveals an interesting phenomenon: at the 60-minute mark, all nine wavelength channels have shifted back by 1–1.7 nm, and the magnitude of this backshift is highly consistent across channels, approximately 70% of each channel’s respective drift.
Random measurement errors at a single point do not exhibit such regularity. When all nine channels change in the same direction and by the same proportion, the only possible cause is a systematic one—namely, that the temperature has indeed dropped slightly.
The most likely explanation is that the temperature-control fan accelerates after 30 minutes, lowering the junction temperature by 4–6 °C. This magnitude corresponds precisely to a 1–1.7 nm reduction.
This incident serves as a reminder regarding testing methodology: conducting a single-point measurement once is meaningless; one must examine trends. If you measure for only 30 minutes, you will conclude that “drift is 5.8 nm”; if you measure for only 60 minutes, you will conclude that “drift is 4.1 nm.” Both conclusions are correct, but neither is complete. What truly matters is the entire curve and the temperature underlying that curve.
Incidentally, if it is confirmed that the temperature dip was caused by fan speed regulation, this is actually good news—it indicates that the system’s overall temperature feedback loop is functioning, resulting in a more stable spectrum during prolonged use.
V. The Purpose of Conducting UL Certification and IEC Series Standard Testing for Products
“LED chip selection → incoming material inspection → hot and cold-state testing of the LED board” constitutes an internal prequalification activity conducted prior to certification. Its value lies in exposing risks associated with the light source in advance, before the complete unit is submitted for inspection, thereby supporting the type testing specified in the following standards.
5.1 UL Certification
- Conduct advance verification of the flame retardancy rating of LED packages and the flame retardancy rating of the PCB substrate to ensure compliance with the UL flame-retardance requirements for the complete device;
- Benchmark the temperature rise test data against UL temperature rise limits to address overheating risks in advance;
- Prepare component documentation, BOMs,and supplier information in advance to meet the requirements for UL filing and the review of critical components;
- Inspect PCB routing, insulation, and spacing to avoid non-conformities in the UL structural inspection.
5.2 IEC 60601-1 General Safety Requirements for Electrical Equipment
- Lamp board temperature rise data is used for the temperature rise assessment of accessible components;
- Insulation of the lamp board, creepage distance, electrical clearance, and grounding continuity shall be verified in advance during the lamp-board stage;
- Evaluate the margin of the rated parameters of components to prevent the risk of overload, overheating, and fire.
5.3 IEC 60601-1-2 Electromagnetic Compatibility (EMC)
- Current fluctuations in the lamp board driver and constant-current circuit, as well as switching noise, can be observed at the lamp board stage;
- Identify the sources of radiated and conducted interference as early as possible to reduce the likelihood of failure in overall device EMC testing; flickering LED beads and unstable current are often early indicators of EMC anomalies.
5.4 IEC 62471 Photobiological Safety
This is the most critical specialized standard for the light source in phototherapy equipment; the spectrum, irradiance, light-emitting area, and exposure duration all depend on the steady-state optical data of the lamp panel.
- The spectrum after thermal stabilization represents the equipment’s true operating spectrum and serves as the input for calculating the photometric hazard classification (hazard-free / Class 1 / Class 2 / Class 3);
- If only cold-state data are measured, spectral drift encountered by the certification laboratory during steady-state testing may lead to a change in the determination of the photobiological safety level, directly resulting in test failure;
- This process controls irradiation uniformity and peak irradiation, thereby preventing localized irradiation levels from exceeding permissible limits and causing excessive photic hazards to the retina and skin.
5.5 IEC 60601-2-57: Safety for Phototherapy Devices
This dedicated standard imposes mandatory requirements on treatment output, irradiation uniformity, output stability, overtemperature protection, and output drift:
- Comparative data between cold and hot states are used to demonstrate the stability of the light source output;
- Verify that the treatment output does not exceed the permissible deviation during prolonged operation;
- Provide empirical data for the design of alarm output, power limiting, and overheat protection logic.
VI. For users looking to purchase a phototherapy device: What should you consider when making your selection?
The points discussed above all reflect an industry-specific perspective. For ordinary users, this can actually be simplified into the “four observations”:
First, check whether the “thermal-state value” has been clearly specified. Do not focus solely on the 660 nm and 850 nm values on the nameplate. You can directly ask customer service or sales: “After the equipment has been operated continuously for half an hour, what is its output wavelength?” Brands that can provide measured thermal-state data and have the confidence to include it in their manuals have put genuine effort into the engineering process; those that are only willing to quote a nominal cold-state value should be viewed with skepticism.
Second, examine the drive and temperature-control design. Search the manual for two key terms: “constant-current drive” and “temperature control / overheat protection.” Constant current means that the wavelength and power will not drift as the device is used over time; temperature control means that, after prolonged use, the device’s spectral output will be more stable and safer. If you cannot find either term in a product, you can generally conclude that its cost has been cut somewhere in the background.
Third, check whether the test report is based on “third-party + steady-state” data. When asking a seller to present a test report, pay attention to two points: the report must be issued by a third-party institution (rather than being merely a self-test), and the test conditions must be steady-state data obtained after continuous operation. Reports obtained merely by running the device for a few minutes after cold startup have limited reference value.
Fourth, consider the irradiance and operating distance rather than focusing solely on the power rating. For two devices both rated at 100 W, differences in LED arrangement and lens design can result in irradiance power densities on the skin that differ by several-fold. Whether the manual clearly specifies the “correspondence between operating distance and irradiance” is another indicator of the manufacturer’s level of expertise.
Final Thoughts
Wavelength temperature drift is not a defect; it is a characteristic. It cannot be eliminated; it can only be managed.
What truly determines the spectral stability of a phototherapy device is three factors: whether the heat dissipation design is adequate, whether the drive solution is appropriate, and whether the testing methodology is reliable. The first two are design issues; the third is a matter of attitude.